About Lew

Lifetime science geek. 'Nuf said.

Spot it! … a combinatoric cornucopia

I came across the Spot it! card game a few months ago, and it didn’t take long to start wondering about the mathematics of the deck design. Here is the game with three cards displayed. Every pair of cards has exactly one matching pair of symbols, as illustrated here where the three pairings share a chess knight, a cat, and a dog.

There are 8 cards that have knights on them, and a little consideration shows that the 8×7 other symbols on these cards must be unique ( since each pair of cards has one match. )  Then there must be 57 symbols, on this fact alone. If there are 57 cards, then each of the 57 symbols can be accounted for if they each appear on 8 cards.

I got this far, then found the blog, BOWMAN IN ARABIA with the article, Math Circle Problem: Analysis of the Game “Spot it!”,  which outlines an algorithm for finding decks of PX(P+1) + 1 cards and the same number of unique symbols, with P+1 symbols on each card, for P prime.

I added a note about a solution for P=4, and I surmised that P = 2N works along with P prime. I wrote ( and refined,  with considerable effort, ) a “brute force” search program, and verified that P=6 does not yield a solution, and proceeded to P=9, expecting the same. However, this search yielded numerous solutions. ( I let it run for several days, thinking that it would stop at 7! solutions, based on simple extrapolation. However, it was still going strong at that point and I terminated the run. ) I then surmised that PN + 1, P prime, yields solutions, and this seems to be corroborated from what I read, and is evidently related to the “Sylow subgroups” of the Symmetric groups (aka permutation groups. )

You could say that’s the end of it, but there are a lot of “pfathinatin” details to be observed in the structure and properties of these solutions. Let us first return to the commercially available SPOT IT! deck, and then consider some other simple cases.

In fact, there are 55 cards in this deck, and it is observed that it must be obtained simply by removing two cards from the mathematically ideal solution. This is verified by the following image of a canonical arrangement of the cards, with the two “missing” cards ( they are not there when you buy them! ) … supplied by the logic explained:
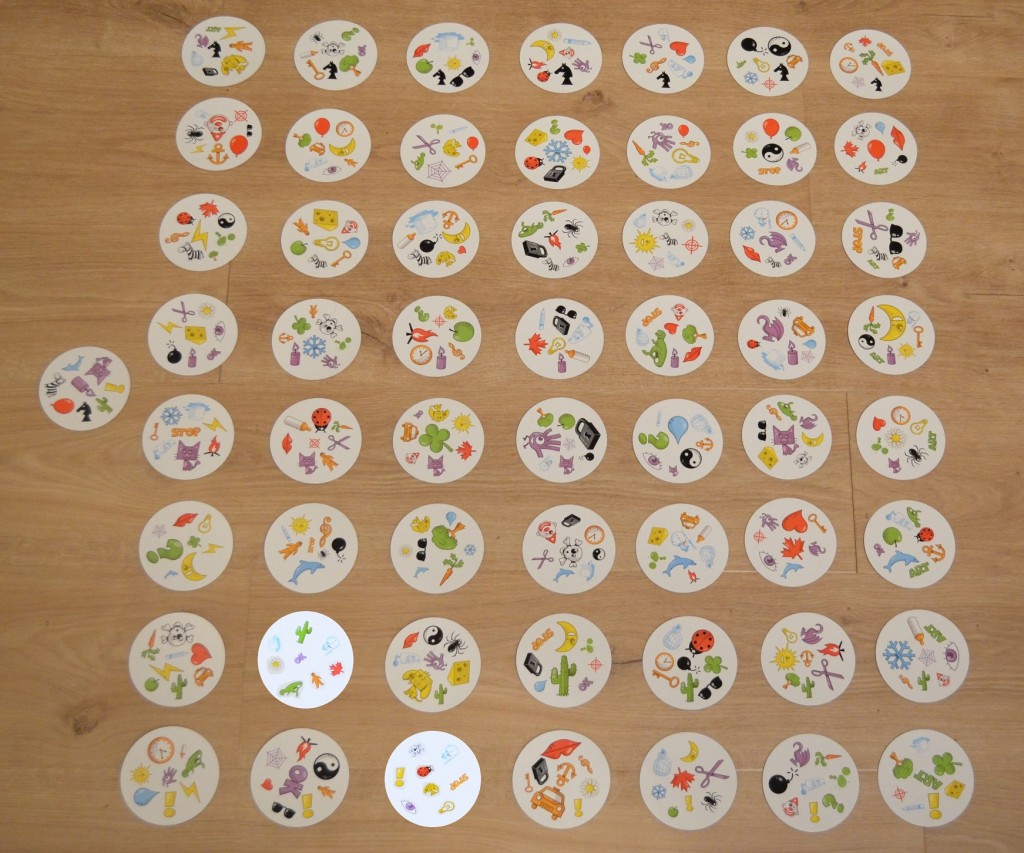
On the left is the arbitrarily chosen ABCDEFGH card, whose 8 symbols are given canonical status. Note that in each of the 8 rows of 7 cards, each card contains the same symbol from the “key card” , with A=knight, B=balloon, etc. ( The “key symbol” is given upright orientation in each case. )

The top row defines 8 canonical sets of 7 symbols, ( excluding the knight, )  one of which must appear in each of the cards of every row. The second row, or “B=balloon” row, arranged in arbitrary order, defines a canonical index into each of these sets, based on the row position of its member symbols. This index is important in algorithms for constructing “solutions”,  i.e. valid SPOT IT! decks.

Then … each subsequent row is arranged so that the symbols matching the left-top-most card, the second key card, are in the same order as the “B=balloon” row, thus forming a 7X7 array of cards, excluding only the “A=knight” cards, indexed in a canonical way by the seven non-knight symbols on the two key cards. Wonderful!

Well, note that we come up with two “holes” in a very natural way, and can fill them in according to the symbol missing in their row from each of the “A row” cards, and this has been done, at great cost of manual labor.

General Principles

But let us return to a simpler case to illustrate some general considerations. The very simplest nontrivial case is 3 ( 2X1 + 1 ) cards with 2 symbols on each card, AB, AC, BC. However, this is a bit too simple, and the next case of 7 ( 3X2+1) cards with 3 symbols on each card is interesting but not too complicated.

It suffices to illustrate the geometric model, where each card is a vertex of a 6-d simplex ( noting that a 3-d simplex has 4 vertices, e.g. ) and each symbol corresponds to a 2-d simplex, or triangle, connecting all of the vertices representing cards with the same matching symbol.
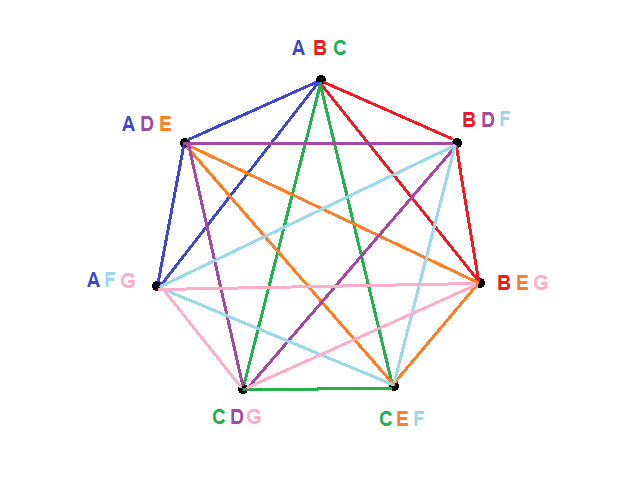
Thus, the whole problem of constructing a deck of N X (N+1)+1 cards is seen to be equivalent to an EDGE COLORING problem on an N X (N+1)-simplex. We require the edges to be colored ( in this case) with 7 colors, such that the edges of 7 2-simplexes ( triangles) have the same (unique) color, and each vertex is shared by 3 of these.

Not sure where that gets us, but it does seem to be a helpful visualization.

Duality

In consideration of the idealized SPOT IT! deck, it appears that just as every pair of cards shares a unique symbol, so every pair of symbols shares, or appears on, a unique card. Thus every deck can be specified in a dual fashion, with a solution that corresponds to itself or another deck.

For the case of N=3 we can see a SELF-DUAL solution if we label each card with a,b,c,d,e,f,g as follows

a=ABC b=ADE c=AFG d=BDF e=BEG f=CDG g=CEF

… indicating which symbols occur on each card. Then the symbols can be specified by the set of cards on which they occur:

A=abc B=ade C=afg D=bdf E=beg F=cdg G=cef

… and we see that we have the same specification with interchange of upper and lower case. I promise you that I typed these out according to the definition, and not by rote! For higher values of N, the solutions are not all self-dual, and I haven’t explored the necessary arrangements.

Permutation of symbols

It seems clear that any solution derived by permuting the symbol values of an existing solution is valid, and will not necessarily involve the same cards, as defined by the symbols appearing on them. In the case of 7 symbols appearing 3 times each on 7 cards, we can easily permute them and “orthonormalize” them to arrive at the 7! = 5040 different results:

$ for i in `perm ABCDEFG`; do tr ABCDEFG $i <ABC | orsort; done | sort | uniq -c

168 ABC ADE AFG BDF BEG CDG CEF
168 ABC ADE AFG BDG BEF CDF CEG
168 ABC ADF AEG BDE BFG CDG CEF
168 ABC ADF AEG BDG BEF CDE CFG
168 ABC ADG AEF BDE BFG CDF CEG
168 ABC ADG AEF BDF BEG CDE CFG
168 ABD ACE AFG BCF BEG CDG DEF
168 ABD ACE AFG BCG BEF CDF DEG
168 ABD ACF AEG BCE BFG CDG DEF
168 ABD ACF AEG BCG BEF CDE DFG
168 ABD ACG AEF BCE BFG CDF DEG
168 ABD ACG AEF BCF BEG CDE DFG
168 ABE ACD AFG BCF BDG CEG DEF
168 ABE ACD AFG BCG BDF CEF DEG
168 ABE ACF ADG BCD BFG CEG DEF
168 ABE ACF ADG BCG BDF CDE EFG
168 ABE ACG ADF BCD BFG CEF DEG
168 ABE ACG ADF BCF BDG CDE EFG
168 ABF ACD AEG BCE BDG CFG DEF
168 ABF ACD AEG BCG BDE CEF DFG
168 ABF ACE ADG BCD BEG CFG DEF
168 ABF ACE ADG BCG BDE CDF EFG
168 ABF ACG ADE BCD BEG CEF DFG
168 ABF ACG ADE BCE BDG CDF EFG
168 ABG ACD AEF BCE BDF CFG DEG
168 ABG ACD AEF BCF BDE CEG DFG
168 ABG ACE ADF BCD BEF CFG DEG
168 ABG ACE ADF BCF BDE CDG EFG
168 ABG ACF ADE BCD BEF CEG DFG
168 ABG ACF ADE BCE BDF CDG EFG

… showing that the 5040 permutations of the symbol tags, ABCDEFG, result in 168 repetitions each of 30 different 7 card decks, each a solution of the SPOT IT! specification.

ABC is a file containing the original 7 card solution

$ cat ABC
ABC ADE AFG BDF BEG CDG CEF


This takes a minute to run on CYGWIN, even with todays mind-bogglingly fast processor speeds, because of the shell level logic. ( “perm” and “orsort” are C programs I wrote. )  So this is my excuse for not offering results for higher values of N.

Generating solutions 

As I mentioned above, my first investigation of the SPOT IT! problem involved writing programs to generate solutions for small values of N, where N is the number of symbols on each card of a deck comprising N X ( N-1 ) + 1 cards. I led off this discussion with a canonical arrangement of the actual commercial SPOT IT! deck,  which  provides the framework for this effort, as noted.

The cards containing two symbols, designated A and B, can be specified in a canonical arrangement which labels all the available symbols, and the solution for a full deck entails specifying additional cards, each with N of these symbols on it, that complete the deck and satisfy the unique matching condition.

Here is the top portion of the image above with numerical indexes overlayed on the symbols, according to the scheme explained:

The symbols on the A row ( other than A=knight ) are labeled according to the position of their occurrence in the second ( B=balloon ) row, which is not labelled because every label corresponds to the position of the card, 1 thru 7. Each card of the A row is labelled with a different color, indicating its column.

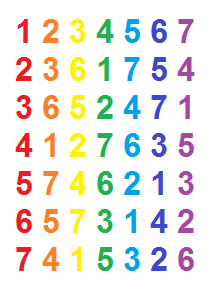
The third, or C=zebra, row has each symbol labeled according to its color and value in the A row. It so happens that for this case of N=8, once the C row is specified, the solution is unique. Using the color to indicate a column, as noted, the labeling generates the array specification:

… and these are the terms in which my program generates solutions. That program found 120 unique solutions in these terms, of which this one happens to be the 14th:

1 2 3 4 5 6 7
2 3 6 1 7 5 4
3 6 5 2 4 7 1
4 1 2 7 6 3 5
5 7 4 6 2 1 3
6 5 7 3 1 4 2
7 4 1 5 3 2 6

1 3 5 7 2 4 6
2 6 7 4 3 1 5
3 5 4 1 6 2 7
4 2 6 5 1 7 3
5 4 2 3 7 6 1
6 7 1 2 5 3 4
7 1 3 6 4 5 2

1 4 7 2 6 5 3
2 1 4 3 5 7 6
3 2 1 6 7 4 5
4 7 5 1 3 6 2
5 6 3 7 1 2 4
6 3 2 5 4 1 7
7 5 6 4 2 3 1

1 5 2 6 3 7 4
2 7 3 5 6 4 1
3 4 6 7 5 1 2
4 6 1 3 2 5 7
5 2 7 1 4 3 6
6 1 5 4 7 2 3
7 3 4 2 1 6 5

1 6 4 5 7 3 2
2 5 1 7 4 6 3
3 7 2 4 1 5 6
4 3 7 6 5 2 1
5 1 6 2 3 4 7
6 4 3 1 2 7 5
7 2 5 3 6 1 4

1 7 6 3 4 2 5
2 4 5 6 1 3 7
3 1 7 5 2 6 4
4 5 3 2 7 1 6
5 3 1 4 6 7 2
6 2 4 7 3 5 1
7 6 2 1 5 4 3

The C row matches, and I spot checked the D, E, etc. rows, which according to my logic must necessarily match.

And now a true confession. Note that the C row array specification is symmetric about the major diagonal. I.e. we have  1, 22, 333, 4664, 51515, etc. reading from the left column up to the right, proceeding from top to bottom. I noticed that the solutions, starting from this canonical form and using brute force search, had this form for small N, up to N=5. I found that for N=8, e.g., the brute force search bogged down hopelessly, searching through fruitless combinations, so I restricted the search to these symmetrical C row arrays, and was able to proceed up to N=9. It rankles me, but I haven’t been able to prove that this condition is necessary, however evident it seems that it must be true.

Concomitant to the symmetric C row array, we see that the other row arrays are each formed by a permutation of the columns of index values into the canonically order sets of symbols defined by the A and B rows. This is a purely empirical observation, but it certainly seems to be true in general, and so I stand in perplexity.

More on enumeration of solutions

I commented above under the “Permutation of symbols” heading,  that brute force enumeration, which I carried out for the case of 3 symbols per card, is not practical for larger values. Note that with 4 symbols per card we have 13 instead of 7 unique symbols, and 13!  =  6227020800, as compared to 7! = 5040.  However, some straightforward reasoning allows us to proceed.

Starting with the case of N=3 symbols per card, we can observe that we must have a unique ABx card, and there are then 5 choices for the third symbol, x, on that card, and each of these cases is equivalent, since the labelling of the symbols is arbitrary. Also every deck containing a different ABx card is different, so there are 5 equinumerous sets of unique decks, all different.

So it suffices to enumerate the decks containing an ABC card. We note there must be an AD card, which must be ADE, ADF, or ADG, and following the same reasoning as above, these define 3 equinumerous sets of unique decks, so now we have 15 sets of decks, each equinumerous with the deck containing ABC, ADE, and we can anticipate from the earlier enumeration of 30 unique 3 symbol decks that each of these sets has 2 unique decks.

So continuing, with ABC, ADE, we must have AFG, and we must have a BDx card, which can be BDE or BDG, so the two possible decks are :

ABC ADE AFG BDF BEG CDG CEF
ABC ADE AFG BDG BEF CDF CDG

… and we have 5*3*2 = 30 unique decks with 3 symbols on each card, given 7 unique symbols, so we move along to the case of N=4.

With 13 symbols, we see that there will be C(11,2) = 55 possible cards, ABxy, with the 11 remaining symbols taken in combination 2 at a time. Then in each case, using ABCD as our exemplar, we will have C(8,2) = 28 possible cards, AExy, and then C(5,2) = 10 AHxy cards, leaving the AKLM card, making 15400 unique sets of 4 Axyz cards. For each these sets, we can form the same number of Bxyz cards ( x,y,z != A ) so we take the case of  { ABCD, AEFG, AHIJ, AKLM } and note that each Bxyz must have one symbol from each of the last 3 in this “A set” . There must be a BEyz, BFyz, and BGyz card, and there are 3!*3! ways to assign {H,I,J} and {K,L,M} to y and z. So there are 36 “B sets”.

Now we come to the point of the matrix solution which completes a deck given canonically chosen “A & B sets”, as described above for the case of N=8, the true SPOT IT! deck. One last factor to account for is the interchange of the remaining symbols after A and B. The matrix solution assumes a canonical order for these, so that it won’t redundantly find solutions obtained by shuffling the matrices around. For N=4 this just means a factor of 2 to allow for the swapping of C and D.

Then, in the case of N=4, we get the unique matrix solution:

1 2 3
2 3 1
3 1 2

1 3 2
2 1 3
3 2 1

Which just means that given

ABCD AEFG AHIJ AKLM BEHK BFIL BGJM CE.. CF.. CG.. DE.. DF.. DG..
there is a unique solution, “up to” interchange of C and D. Note that CE, CF, CG, DE, DF, DG must each be present, and this is accounted for in the matrix solution by setting the first column always to 1,2,3 as indexes to  E,F,G in the second position of the “B cards” .

This brings us to N=8. The reasoning just adduced gives a general formula for any N, which applied to N=8 becomes, for the number of “A sets” :

C(56,7) * C(49,7) * C(42,7) * C(35,7) * C(28,7) * C(14,7) / 8!  =

56! / ( 7! )^8 / 8! = 42354925592620124113657511548409579520000

… and for the number of “B sets” for each “A set” : (6!)^6 = 139314069504000000

… throwing in the factor of 6! for the permutation of C,D,E,F,G,H and recalling that there are 120 matrix solutions to every “A & B set” specification, we have a grand total of:

509815040933983250324665926101388800612911244378112000000000000

unique 57 card SPOT IT! decks, using the same 57 symbols. And the 57! permutations of the symbols of any one of these will produce 79493377501440 copies of each of them.


PHABULOUS!

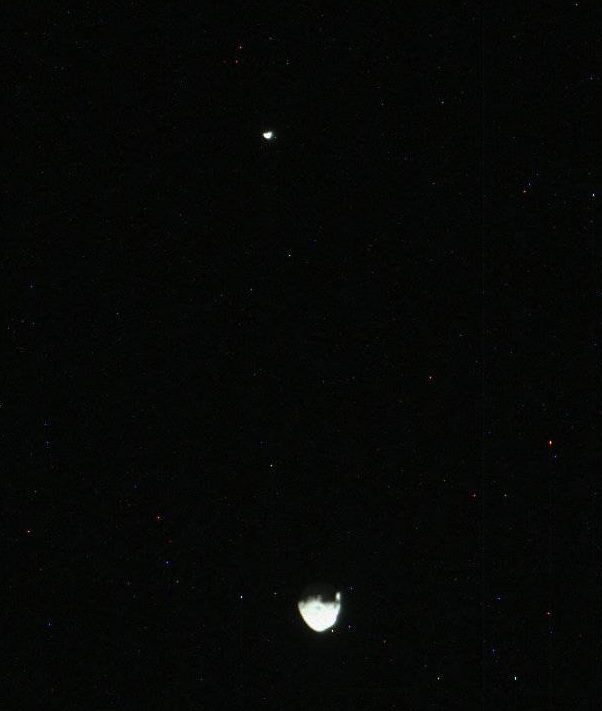
Here’s an excerpt of a sol 351 Curiosity Mastcam image catching Phobos ( at bottom ) passing by Deimos high overhead in the wee hours, local time, 2013-08-01 08:44:11 UTC as labelled in the Raw Image Gallery. You can clearly see the features of Phobos, which make it very reminiscent of the Death Star.

I can recreate this event with my Starry Night software by setting my viewing coordinates to the Bradbury landing site on Mars. However, it doesn’t seem to quite match up in detail, and I can’t even come close to identifying the background stars. So that’s a bit of a mystery to me.

I haven’t seen any publicity for this yet on the Mars Science Laboratory web site, but I guess they’ll get around to it. There was publicity for a series of Navcam photos from Sol 317 made into a movie, but that was at low resolution.

sol 347

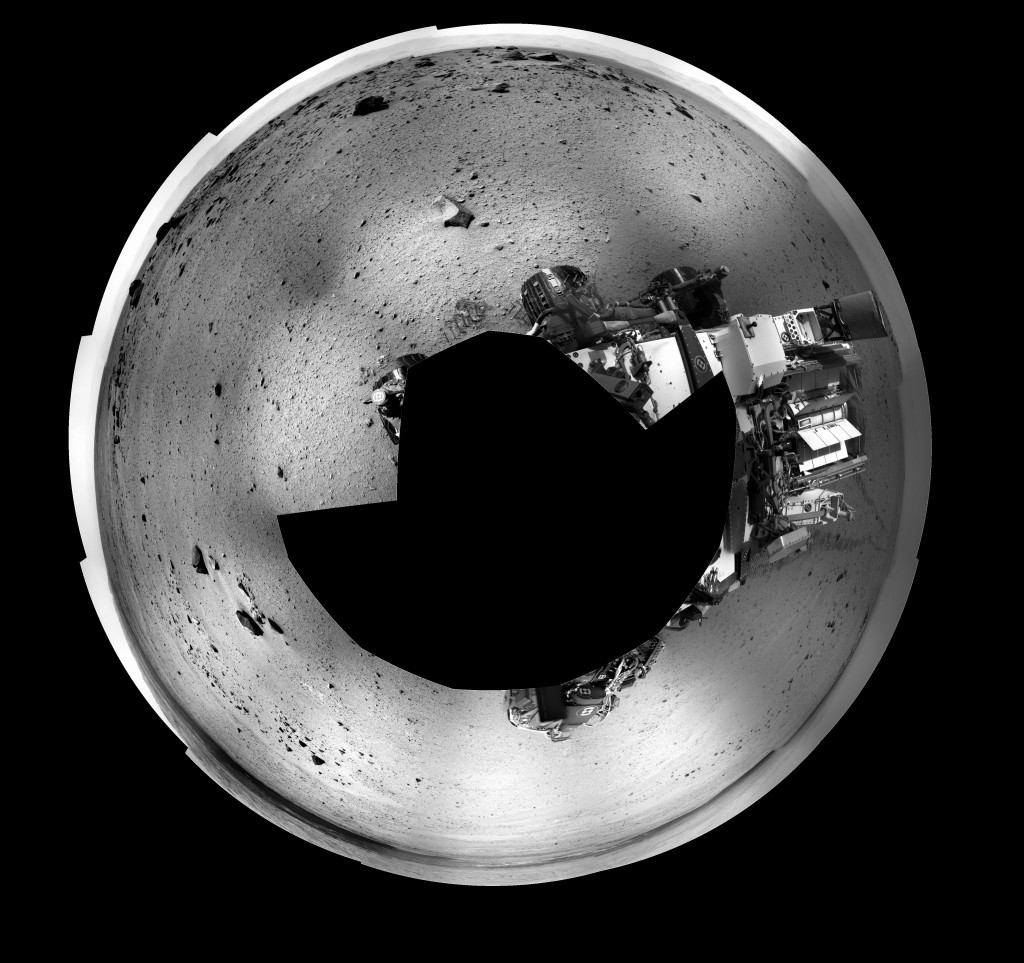
Here is a circular panorama made from the sol 347 Right Navcam raw image gallery. The ( relatively ) rapid progress during the last 10 sols or so have afforded  some interesting views, but the most interesting thing is the overall progress itself. Even though it has been just a few hundred meters, there have been a number of new landmarks in the form of rock piles. On each sol we can see the track of Curiosity trailing off to the east in the direction of “Fort Apache”, as evidenced in this image near three o’clock. Mt. Sharp is all along the bottom edge, and “Mt. Fuji” is near one o’clock.

Here is the upper left quadrant as a cylindrical panorama composed of 6 Navcam images. It gives a view of the “rock piles” which dot the area, and of which “Rocknest” was a much smaller example. There were several piles near Rocknest similar to it. My own blue sky theory is that these represent secondary impact events. … It’s gotta be something!

Farewell to all that

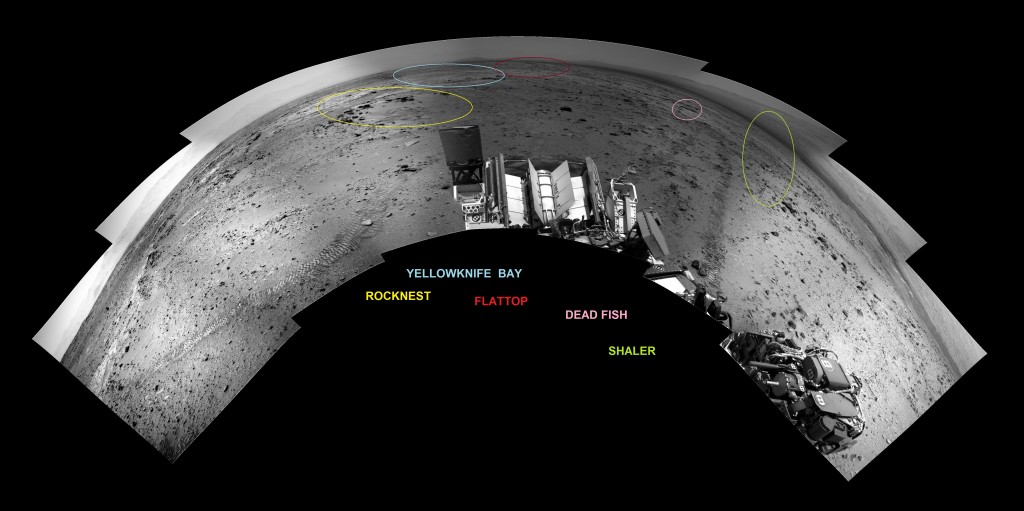
As Curiosity “head’s out of town” on Sol 329, it captured the six images in this spherical panorama with its Right Navcam. ( Click to enlarge. ) I’ve labeled a few of the landmarks ( including some I named in previous posts. ) You may note that it seems to be heading away from Mount Sharp, which is its destination. It is going back the way it came, and I think the idea is to traverse the high ground near the landing site, rather than risk getting bogged down in the dunes along the base of the mountain.

Kinematics of a close encounter

At the time of the August 2003 Mars opposition much was made of the “moment of closest approach” and I began thinking about how long this “moment” would last, within various limits, such as the diameter of Mars, or even a mile, or a foot.  The distance between the planets is not a dynamically significant measure in this case, since the force between them is small and doesn’t substantially affect their relative motion, so this is a problem in “kinematics”, meaning mere description of the motion. Furthermore, we only require an approximate formula for this distance around the time of closest approach.

With the May 31 2013 close approach to earth of “(1998) QE2”, this subject again presented itself. This time I watched a webcast of a telescopic camera image which had live commentary excitedly announcing the moment, or at least the minute of close approach, so I got to thinking about it again.

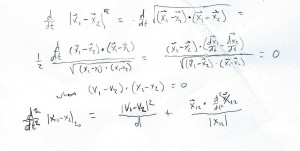
This time, I decided that a good model was a straight line pass at constant speed, and derived a formula for the distance as a function of time based on that. In 2003, I had used the approximation of circular motion obeying Kepler’s Third Law to derive the relative acceleration of Earth and Mars. Revisiting the idea, I realized that I had neglected the effect of overtaking, which my new straight line model emphasized. So I thought I should try a derivation, and putting pencil to paper, I immediately wrote down the following, and I was very pleased to see that it settled the whole thing in the simplest possible way:
… the two terms represent the kinematical “acceleration” of the distance value, and the true dynamic acceleration projected along the unit vector of the displacement between the bodies, or planets. ( Note d = |x12t0 ).

QE2 Close Approach

With this in hand we may examine the NASA ephemeris data for the close approach of (1998) QE2, which conveniently features “delta” and “deldot”, which are the distance in AUs and the time derivative of same. “dot” is here the Newtonian convention of indicating the time derivative of a variable.

This table is excerpted from results obtained with the JPL HORIZONS web interface. You’ll have to search for “1998 QE2” and then change the start and stop times, and the step size to 1 minute, then click Generate Ephemeris. There is a lot of other data in the table, as you’ll see.

In the excerpted data below, note that the deldot values are almost evenly spaced with a constant difference of about 0.0011649 km/sec, representing a pseudo-acceleration along the line of sight of 0.0011649 km/sec/minute. So the appearance along the line of sight is similar to that of a thrown ball, say, rising towards a viewer positioned at a height, then falling away. Note that the acceleration is 1.11649/60 m/sec2 or about 0.0019 g , so this is a rather slow motion affair. It takes about 1 minute for the speed of approach/recession to decrease/increase by 1 meter/second .

Date               Time ( UT )           delta ( AU )                     deldot ( km/sec)

2013-May-31 20:44:58.068        0.03917532423283        -0.0163077
2013-May-31 20:45:58.068        0.03917531792555        -0.0151429
2013-May-31 20:46:58.068        0.03917531208546        -0.0139781
2013-May-31 20:47:58.068        0.03917530671257        -0.0128133
2013-May-31 20:48:58.068        0.03917530180688        -0.0116484
2013-May-31 20:49:58.068        0.03917529736839        -0.0104836
2013-May-31 20:50:58.068        0.03917529339710        -0.0093188
2013-May-31 20:51:58.068        0.03917528989301        -0.0081540
2013-May-31 20:52:58.068        0.03917528685613        -0.0069891
2013-May-31 20:53:58.068        0.03917528428646        -0.0058243
2013-May-31 20:54:58.068        0.03917528218400        -0.0046594
2013-May-31 20:55:58.068        0.03917528054875        -0.0034946
2013-May-31 20:56:58.068        0.03917527938071        -0.0023297
2013-May-31 20:57:58.068        0.03917527867989        -0.0011649
2013-May-31 20:58:58.068        0.03917527844628         0.0000000
2013-May-31 20:59:58.068        0.03917527867989         0.0011649
2013-May-31 21:00:58.068        0.03917527938073         0.0023297
2013-May-31 21:01:58.068        0.03917528054878         0.0034946
2013-May-31 21:02:58.068        0.03917528218406         0.0046595
2013-May-31 21:03:58.068        0.03917528428656         0.0058244
2013-May-31 21:04:58.068        0.03917528685629         0.0069893
2013-May-31 21:05:58.068        0.03917528989324         0.0081542
2013-May-31 21:06:58.068        0.03917529339743         0.0093191
2013-May-31 21:07:58.068        0.03917529736885         0.0104840
2013-May-31 21:08:58.068        0.03917530180750         0.0116489
2013-May-31 21:09:58.068        0.03917530671338         0.0128138
2013-May-31 21:10:58.068        0.03917531208650         0.0139787
2013-May-31 21:11:58.068        0.03917531792686         0.0151436
2013-May-31 21:12:58.068        0.03917532423446         0.0163085

If we change the step size to 1 hour, we see that the spacing of deldot still remains close to a constant, but a systematic drift is evident, represented by a linear increase in the spacing with time, meaning the (pseudo) acceleration increases with time in the direction away from the earth POV, so the approach slows down, but the retreat speeds up.

2013-May-31 08:58:58.067       0.03929608858667       -0.8350130
2013-May-31 09:58:58.067       0.03927682497794       -0.7658902
2013-May-31 10:58:58.067       0.03925922624191       -0.6966541
2013-May-31 11:58:58.067       0.03924329499832       -0.6273135
2013-May-31 12:58:58.067       0.03922903365661       -0.5578770
2013-May-31 13:58:58.067       0.03921644441785       -0.4883535
2013-May-31 14:58:58.067       0.03920552926676       -0.4187518
2013-May-31 15:58:58.067       0.03919628997722       -0.3490808
2013-May-31 16:58:58.067       0.03918872810782       -0.2793494
2013-May-31 17:58:58.067       0.03918284500170       -0.2095666
2013-May-31 18:58:58.067       0.03917864178520       -0.1397414
2013-May-31 19:58:58.067       0.03917611936989       -0.0698829
2013-May-31 20:58:58.067       0.03917527844677        0.0000000
2013-May-31 21:58:58.067       0.03917611949120        0.0698981
2013-May-31 22:58:58.067       0.03917864276007        0.1398025
2013-May-31 23:58:58.067       0.03918284829222        0.2097040
2013-Jun-01 00:58:58.067        0.03918873590808        0.2795937
2013-Jun-01 01:58:58.067        0.03919630521201        0.3494624
2013-Jun-01 02:58:58.067        0.03920555558842        0.4193011
2013-Jun-01 03:58:58.067        0.03921648620645        0.4891009
2013-Jun-01 04:58:58.067        0.03922909601848        0.5588527
2013-Jun-01 05:58:58.067        0.03924338376138        0.6285477
2013-Jun-01 06:58:58.067        0.03925934795697        0.6981768
2013-Jun-01 07:58:58.067        0.03927698691478        0.7677314
2013-Jun-01 08:58:58.067        0.03929629872991        0.8372025

Some fairly simple considerations of the nature of our approximate calculations will show why it works as well as it does, and give a value for the “next order” of deviation from it.

THE INERTIAL EARTH FRAME OF REFERENCE


Just as the Space Shuttle bay provided a “free fall” environment as it orbited the earth, the vicinity of earth is a “free fall” environment for objects near it. That is, we do not need to know what orbit they are following, but can consider them to be in free fall with the earth. Two forces limit this assumption. The first of course is the gravity of the earth itself, and the second is the “tidal” or differential field of the sun’s gravity near the earth, which in first approximation grows in proportion with distance from the earth.

Which of these is greater for our case of a close approach at about 0.04 AU ?

The force of earth’s gravity, measured by g at the earth’s surface, diminishes in inverse proportion to the square of the distance from the earth, measured in earth radii, re . Since 0.04 AU is about 940 re, We expect an acceleration due to earth’s gravity of about 1/88400 g or 0.000011 m/sec2 at that distance.

The acceleration due to the sun’s gravity at 1 AU is measured by the centripetal acceleration of the earth in its orbit, that is ( 2pi/1 year )2 1 AU, which comes to 0.006 m/sec2 . The tidal force is measured by the distance in AU times this value, or 0.000240 m/sec2, about 22 times as great as the earth’s gravitational pull. The exact direction and magnitude of the solar tide depends on the relative position of the object, just as the tides of the earth ocean vary with the position of the moon and the sun in the sky, but we may consider the value, once calculated, to be constant in the next order of approximation.

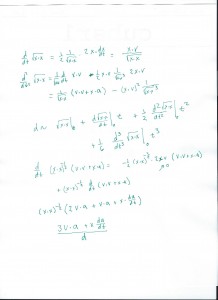
Here is a derivation extending our approximation to the “third order” in time:

The expression at the bottom has a “kinetic” term linear in the (dynamic) acceleration and a term representing a variable dynamic, or true, acceleration. If we assume a constant dynamic acceleration, the second term vanishes of course. The first term is intuitively due to the acceleration along the path perpendicular to the line of close encounter, since time, in this case, signifies only the position along that line, so we may regard acceleration as a displacement in the time scale. Got it? OK then! Actually, this is how I conceived the idea in the first place, and I did the derivation just to provide a formal justification.

Terminat hora diem, terminat auctor opus

Myriads, Millions, and Zillions

In his essay, The Sand Reckoner, Archimedes specified a system of nomenclature for large numbers.  ( The greek title is yammites which is simply, “sand”. Interestingly, Liddel and Scott’s Intermediate Greek Lexicon includes yammakosioi, a “sand-hundred”, stated to be a “comic word”, presumably like “gazillion’, indicating a “countless multitude”. )

The Greeks had names for ten, hundred, thousand, and ten thousand, which was the myriad, and by composition had expressions for numbers up to the myriad myriad, which Archimedes used as the base of his system, and which we designate here by M. He called the numbers from 1 to M the first order of numbers, and using M as a unit of the second order, counted from M to M2, which became the unit of the third order. Continuing in this way, he postulated M such orders, counting up to MM.

He then called this the 1st period of orders, and continued with the 1st order of the second period counting in units of MM up to MM+1. Then M orders of the 2nd period count up to M2M, and finally the Mth period counts to MM2, which was the limit of his system.

Note that the orders of each period all count from 1 to M, so that the M periods of M orders comprise M2 orders all together, accounting for M2 factors of M.

This system of Archimedes is considered as something of an oddball, but it is actually familar to us in the form of our number naming system, if we take M to stand for “million” instead of “myriad myriad”.

Note that “million” derives from the Italian, “millione” meaning “grand thousand”,  i.e. a thousand thousand, so our million corresponds directly to the myriad myriad, or “grand myriad”, even though different in value. Then we see that the “long scale” or European system, which uses a million as a multiplier, starts off just like Archimedes’ system, with the numbers of the second order counting by millions up to one billion, the unit of the third order numbers, which count up to one trillion, and so on.

Well then, how well does our nomenclature keep up with Archimedes in this analogy?  The first sign of trouble ahead comes at  the end of the 1000th order, when we hit one milliatillion, as this is where the nomenclature plays its last card. Still, we make out OK up to the end of the first period, where the one millionth order ends at one milliamilliatillion.

Now in the Archimedian system, we “start fresh” at each period, so we can specify an order of each period between one and one million and get any power of a million up to a million million. In the modern “long scale” we are stuck with concatenating an extra “milliamillia” for each period, and the unit of the first order of the 5th period is

one milliamilliamilliamilliamilliamilliamilliamilliamilliamilliatillion

( I’ve been using the site: The English name of a number, for these values. Set “power of ten” and “European ruleset” . )

So I think Archimedes wins the point. But could we extend the modern nomenclature to accommodate the Archimedean scheme? This would mean extending it to one million periods, and in fact this can very easily be done.

Just as the suffix “-tillion” indicates powers of one million, we can introduce the suffix “-zillion” to indicate powers of milliamilliatillion, or one million to the one millionth power. Each period introduces a factor of one zillion, so we can call the largest number of the second period one bazillion, in analogy to one billion as a million million ( in the “long scale” ) . Then we march through trazillion, quatrazillion, etc. in one to one correspondence with the orders of the first period, and the largest number of the millionth period, which is the limit of this scheme, is one miliamilliazillion. So there you are.

RUDY RUCKER’S “SUGGESTION”

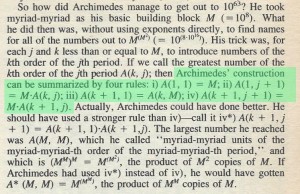
Rudy Rucker makes some cursory but pithy comments in his 1983 book, INFINITY AND THE MIND. Here is an excerpt from my copy of the Bantam paperback edition.

Regarding the highlighted recursion rules, there are two mistakes. The first is a trivial error in ii) A(1, j+1 ) = M*A(k,j) which evidently s/b ii) A(1,j+1) = M*A(1,j), noting that rule iv covers values of k > 1, ( although it allows k+1 = M+1, which we shall overlook.)

The second error is not so easily dismissed. This is in iii) A(k+1,1) = A(k,m), which s/b iii) A(k+1,1) = M*A(k,M), since A(k,j) is the GREATEST value of the jth order of the kth period, and A(k,M) is the UNIT of A(k+1,1) . I checked this out with actual recursive definitions in “bc” on cygwin, for low base values such as 3,4, and 5, so don’t doubt me!

But what about this? I think it’s all explained by the author’s  suggested improvement using rule iv*) . The modified rule, with the other rules as stated ( except for the above cited trivial correction ) does produce values of A(M,M) = M^M^M, as claimed, so it would appear that the original formulas were reverse engineered from the “improved” version.

The machinations of the latter can be easily discerned. The “highest values of the orders of the periods” ( inconsistently so called )  progess as follows:

M        M2       … MM
MM      M2M      … MM2
MM2     M2M2     … MM3

MM(M-1) M2M(M-1) … MMM

… but this seems to bear very little relation to Archimedes’ scheme, which is based on simple enumeration. The multiplier value of M comes from counting 1 thru M in each order of each period, and this is the defining principle. It is the unit of the enumeration that changes, and the numbers of all the orders are the same, namely 1 thru M.

But nevertheless ! … there is a connection, and Rucker’s modified formula is contained in the Archimedean scheme. Note the very suggestive sequence of      A(k,M) = MMk , where k=1 corresponds to the end of the Mth order, and k=2 corresponds to the end of the Mth period. The suggestion is namely that we consider orders and periods to be the 1st and 2nd levels of a generalized sequence of nth level periods.

Furthermore, each row comprises successive powers of the first element, as specified by rule iv*). So Rucker’s scheme gives a summary of the values reached by the jth element of the kth-level period, j and k passing from 1 to M.

Note that it would require a recursive function with M arguments to specify M levels of periods in a direct continuation of the original scheme.

It seems that Rucker must have used this reasoning, or some form of it, to derive his function, but his remarks that Archimedes “could” and “should” have made a similar specification remain puzzling.

Fun with semiotics

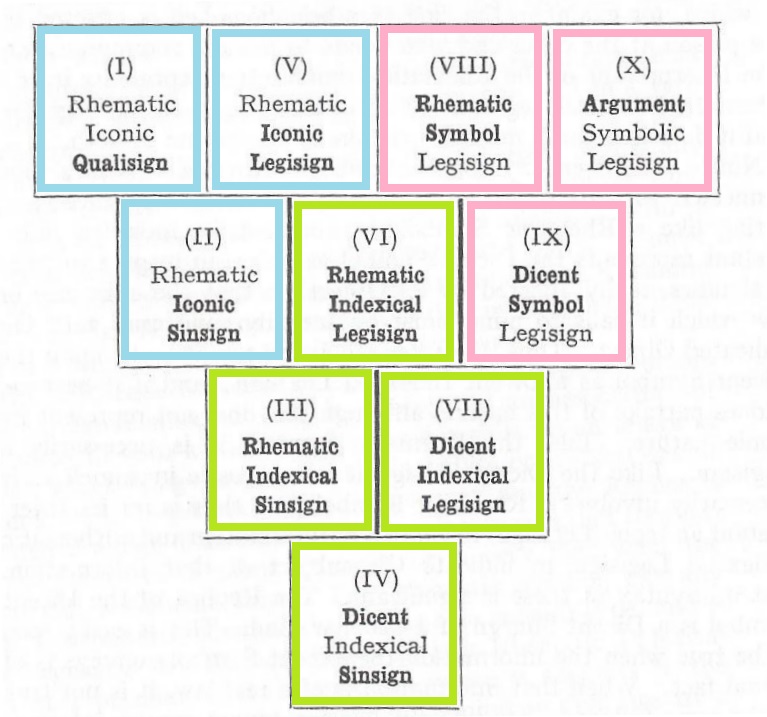
Charles Sanders Peirce, in his essay, LOGIC AS SEMIOTIC: THE THEORY OF SIGNS, presents a diagram displaying the ten types of signs in a triangular array, like bowling pins. These are categorized by three different threefold classifications, his “three trichotomies”, which allow for the specification of 27 types, but only ten are valid. There’s a very simple rule that performs this reduction, but it is not specifically enunciated, that I can notice, even though you can see him applying it.

The Wikipedia article Semiotic elements and classes of signs makes the rule fairly clear with a diagram, but again does not specifically enunciate it, saying simply, ” many co-classifications aren’t found”.

Some years ago, in my own ruminations of the essay I cited, I realized the rule was simply this, that in each label, reduced to a three digit ternary number, abc, where a, b, and c are elements of {0,1,2}, we must have a >= b >= c. Thus when b=0, specifying an Icon, we can only have 000, 100, and 200. The logic of this is that each succesive category can only partake of a quality present in the previous category, so that the Qualisign, 000, is unique, and conversely the Argument, 222, is as well.

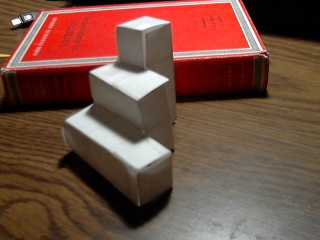
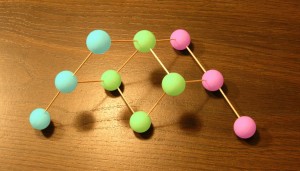
Realizing all this, I made a model representing the subset of the 3X3X3 cube:


This crude model is a number of years old, and its survival is no doubt partly due to its simple construction, as it is composed of exactly two identically folded paper pieces, a reflection of the symmetry of this subset of the cube. It is essentially, except for edge conditions, 1/6 of the cube, as partitioned by 3 bisecting cuts along a major diagonal. I felt that all this symmetry impinged, or ought to impinge on the significance of the categories, but I never pursued such thinking. Nevertheless, the construction does serve as a powerful mnemonic, and stands as a rival to Peirce’s own diagram.

Well, just lately, I had the thought to make a direct comparison of the two, and found that there is a direct relationship, and in fact Peirce’s tableaux does embody most of the symmetry of the cubic model, even if it doesn’t directly display the restrictive rule.

So with that preamble, here is Peirce’s tableaux marked to display the groupings of the Icons, Indexes, and Symbols:


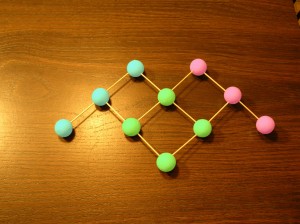
Then here is a new model of the cubic representation using a lattice so you can see all the elements, and of course the same color coding. You can see that the Icons, Indexes and Symbols belong to three separate planes perpendicular to their defining axis:
This is suggestive, but how can we relate this lattice directly to the Tableaux? A start is to try a projection, or view along an axis of symmetry, to spread things out a little. Here is such a view of the same model:
This goes pretty far. Note that the ( green ) Indexical categories do in fact correspond to the Tableaux. ( You may believe me that the correspondence is exact. ) However, the other elements are out of whack. The three rows of this projection are not the same as the rows of the Tableaux.

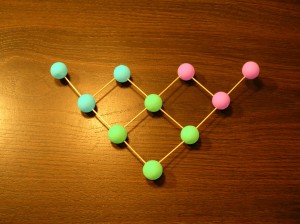
We can almost rectify everything by flattening the lattice.  This only requires “unbending”  the two right angle connections between the blue and green, and the pink and green:
This is almost it! We have retained the connective character of the lattice model, and come very close to Peirce’s original representation. In fact, we could modify the Tableaux by a simple cut and paste of the Argument and Qualisign elements. But let us bow to precedent and esthetics, and simply swing the lattice elements, which have only one connection, into the “correct” place, and we have an exact correspondence without really sacrificing anything:

Comet of the Century

It cleared today and I figured this was my one and only chance to observe the comet PanStarrs, so I sojourned to the site of Lew’s Garage, proper, this night of March 13, 2013. There I did observe the comet, and managed to obtain this image of it, although I must say it’s a little rough around the edges, and certainly doesn’t do justice to the entire experience. It was getting colder and the ice in the fields was freezing hard and letting me know about it with a background of crackling sounds. I might have thought I was in the arctic. I certainly felt cold enough.

It looked a little better through my Celestron 9X63 binoculars than the image would indicate, but it was fleetingly visible, as it was on the verge of being obscured on the horizon just as the sky darkened sufficiently to see it. So, all in all, a major triumph.

Sleuthing Chelyabinsk

Like many others, I was astounded not only by the Chelyabinsk meteor fall itself, but by the seemingly  outlandish estimates of the power of the “explosion” which was presumed to have caused the damage on the ground. I believe they’re saying 500 kilotons now. At one point I was ready to give in and go along, but in perusing the extensive Youtube material and other references, I saw others voicing many of the same points that I had thought of, for example that “there was no explosion” ( ! ) How can you say there was no explosion ! Well, because the brilliant flash lasting for several seconds traveled through the air for some miles during that time, then blinked out. What was left was a smoke trail. Then, a LONG time later, as much as two minutes it seems, there was a huge but very sharp crack that did the damage, followed by a series of much less intense bangs and pops that sounded like gunfire. It certainly seems that all of these were “sonic booms”.

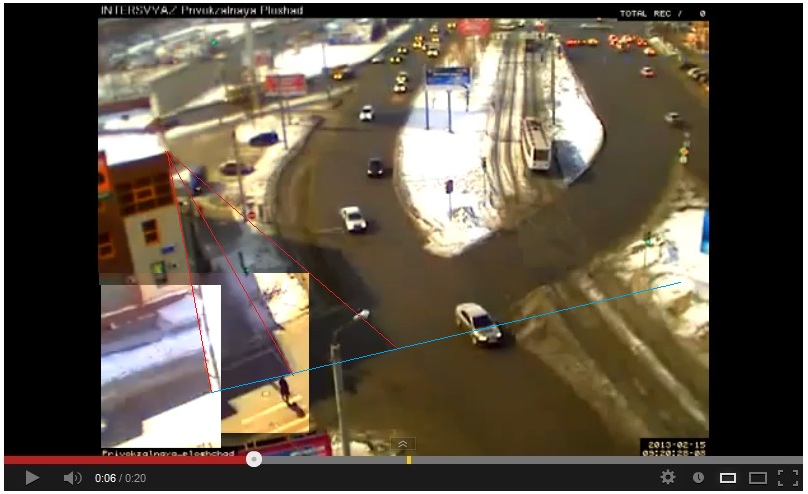
Well, enough generalities. Let’s just look at a simple analysis of the “traffic camera” video. Here’s a composite of three frames with some lines drawn on it:

The red lines are drawn from the corner of the building to its shadow at three different times, with the lapse of 2.0 seconds, and 1.0 seconds between them. The two later shadows were pasted on to the original scene. Then the blue line connecting them gives a record of the track of the meteor flash in the sky. The corner of the building has ( lat, long ) = ( 55.143470, 61.414289 ), incidentally. That was some sleuthing right there! The view is slightly to the east of due south.

Now concentrating on the last interval of one second, we see that this is near the closest approach of the meteor to this location, and eschewing trigonometry, we can estimate that the red sides of the triangle formed by the line of sight forming the shadow track, are to the blue baseline of the track, as 8 to 3. We simply note that we are looking more or less face on to the triangle from the vantage of the camera and estimate from the image.

The point is that the distance of the meteor from the location is in the same 8 to 3 ratio to the distance it flew during that one second. Suppose it was moving at Mach 10, then it flew about 2 miles in that time, and the distance is then 16/3 miles, or say 6 miles … not very far away! We may suppose about 4 miles high and 4 miles along the ground.

I had first noticed that the elevation above the horizon changed considerably among the videos that seemed to be taken around the Chelyabinsk area. ( There is one stated to be from Magnitogorsk, which is 150 miles away. The angle of view looks right, but 4 miles only gives you about 1.5 degrees above the horizon. It was very low, actually, so I’m sticking with my estimates for now. )

In several videos people are standing around gawking at the smoke trail when the big bang comes. I saw a comment saying that the bang was produced earlier and this is why it arrived so late, as the meteor outran it over a long distance. I had started thinking that myself when I decided that the smoke trail couldn’t be 20 miles high, and 500 kilotons just does not compute!

Anyway, I think the shadow videos ( there’s another of the Chelyabinsk city square ) are very robust evidence.


Update:

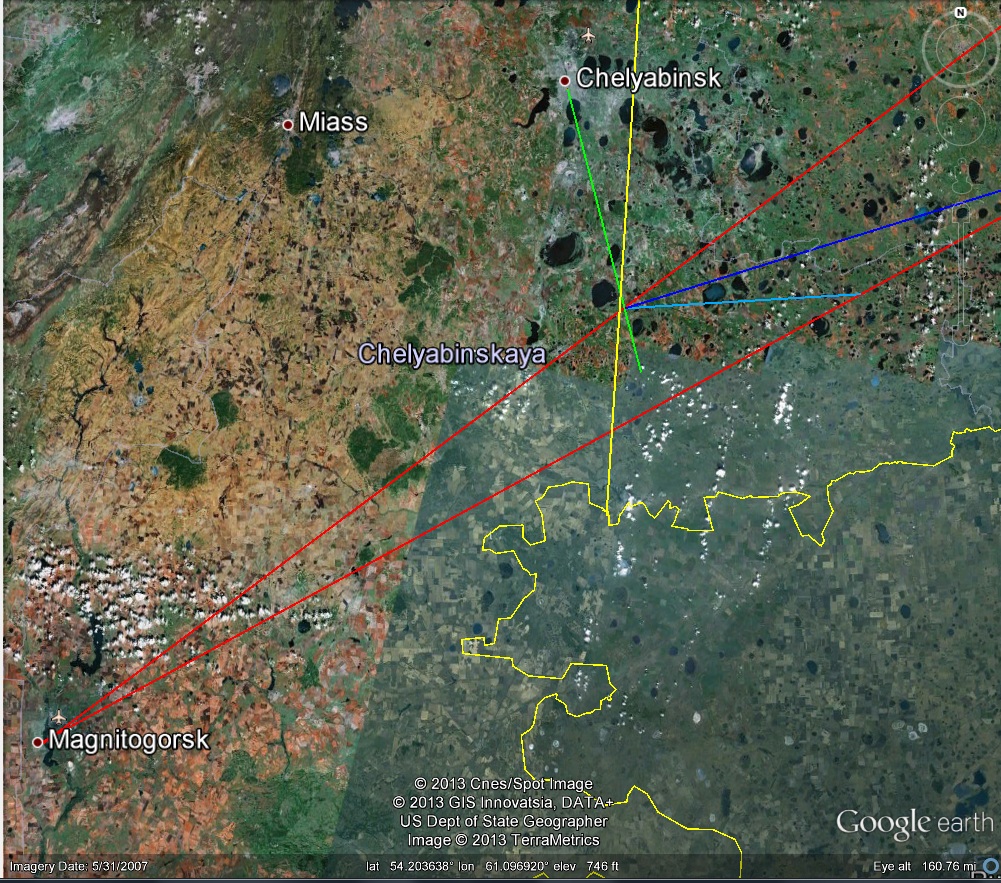
I sleuthed the location of the Magnitogorsk video, which enabled me to get a triangulation on the meteor path based on local landmarks. The red lines on the Google Maps screen shot are my estimates of the lines of sight to the first appearance ( on the right ) and the flareup from the site. Being at right angles to the Chelyabinsk lines of sight estimated from the shadow video, I think it gives a pretty good location, although far from exact. It’s much further south of Chelyabinsk than I had been thinking, which means it’s a lot higher ( ahem ). The yellow line is a line of sight to the flareup from Kamensk-Uralsky, about 100 miles north of Chelyabinsk. The dark blue line is parallel to the ground track of the shadow in Chelyabinsk, and the light blue line is an attempt to account for the tilt of the trajectory, which means it must be displaced that way, but maybe not that much.

BTW, putting the track to the south this way makes a discrepancy with its placement in the weather satellite photo, so that’s another problem. One must have patience.

Update 2:

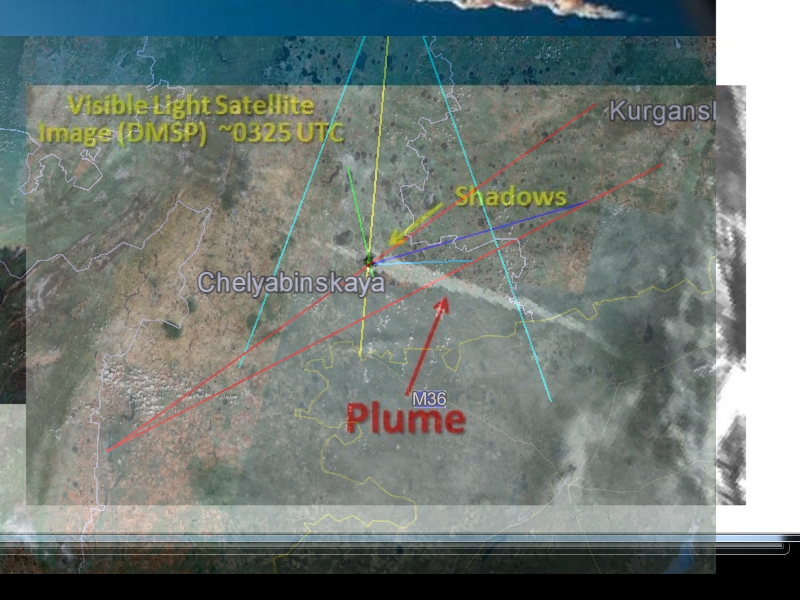
Here’s a Colorado State University montage incorporating an annotated version of the extant weather satellite image of the Chelyabinsk Meteor plume ( btw, that’s “che YAH binsk”, as I hear it in Russian reportage ) :
… and here’s an overlay of my marked up Google Earth image from above, aligned using the dark spots which appear near “Chelya..” as above:

The “dark spots” line up very well, so the overlay seems accurate. Note the excellent agreement of my line-of-sight location of the “flash” with the “plume turrets” identified by CSU. Note also my UNDERestimation of the effect of the inclination on the estimation of the ground track based on the shadow track. The extra light blue lines radiating from Kamensk-Uralsky are my estimate of the extent of the visible smoke trail in the seconds after the flash. This includes a significant length to the west of the flash, as shown also in the CSU montage.

So, I guess I should be happy now, but I still can’t bring myself around to 500 kilotons!

The 15 minute miss

Bill Nye the Science Guy gave the figure of 15 minutes for the amount of time by which the earth will miss a collision with asteroid DA14 at closest approach a few hours from now. What does this mean? I believe the idea is that the orbits of the earth and the asteroid intersect, and that the difference in the time of a passage through the point of intersection is 15 minutes. We can derive the 15 minute figure by taking 2pi times 93 million miles and dividing by 4 * 24 * 365.25, which gives the distance the earth moves along its orbit in 15 minutes, in the traditional approximation, that is. This comes to 16664.848 miles, near enough to the 17240 miles of the official close approach distance to justify the logic of this assumption. But is the premise of this idea correct?

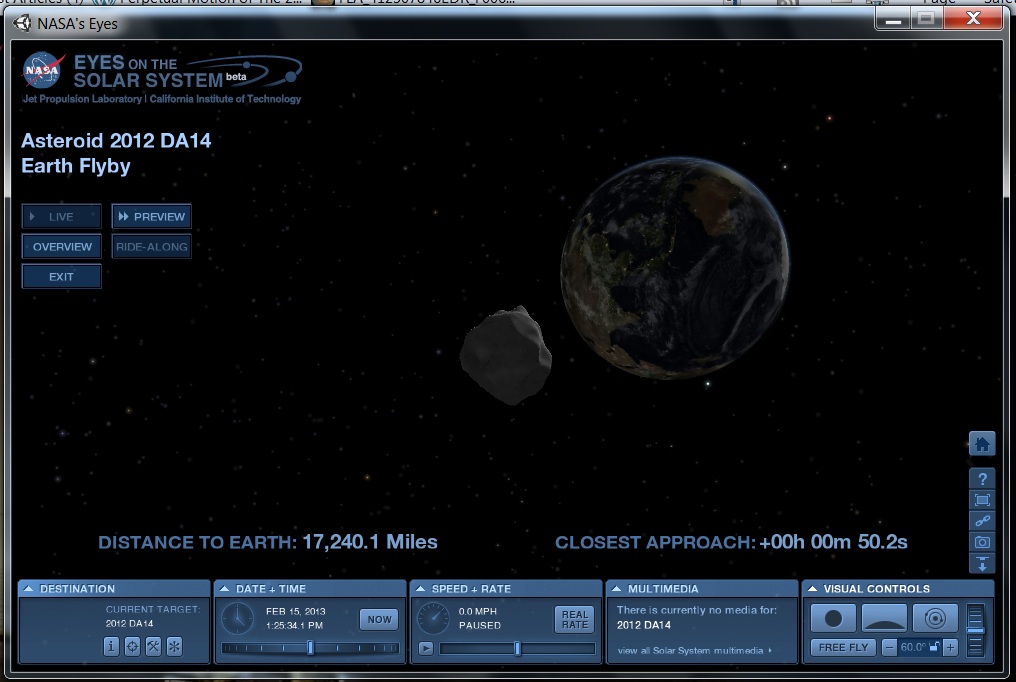
Not really! Here is a screen shot from a downloaded version of JPL’s Eyes on the Solar System, the basis for a video that’s also available on the internet:
If you download the player, as I did, and feel your way through the controls and options, you will see that you get a lot of extras over the video. Notably, the player renders the night side of earth, which is not in the video for some reason. Note in the screen shot that Mars, Mercury and Uranus are all visible ( at about 2 o’clock of the earth’s disk for Mars and Mercury, and 5:30 for Uranus. )

The point is that DA14 is just opposite the sun at closest approach, so it appears that the timing was near perfect for a collision, but the orbits do not in fact intersect, with DA14 passing “spaceside” in the plane of the ecliptic.

You can see that the principal motion of DA14 relative to the earth is from below the plane of the ecliptic to above it, and nearly perpendicular. In fact, the earth is overtaking and passing DA14 along the line of its orbit, as can be seen in the NEO Orbit applet for DA14, even though the approach is too close to be seen in detail on the available scale.

The period of DA14 is 314 days, but its semimajor axis is .91 AU, or 91% that of earth’s orbit. Since it is near the peak of its arc, so to speak, it is analogous to a suborbital missile at its apogee being overtaken by an orbiting satellite at the same altitude.

Well, we avoided a collision, but we still got hit by an astronomy lesson.